
Edmonton rental market, October 2026: vacancy at a four-year high, rents down

Manny Fuller
Partner, Investments & Transactions ·
A note from Manny
Rents have softened and vacancy has climbed to its highest level in four years. Budget for a longer lease-up and the occasional incentive; right now that is the normal case. Financing costs are steady, with the Bank of Canada on its seventh straight hold at 2.25%. Multifamily cap rates ticked up to 5.39%, which helps if you are underwriting a purchase and is worth watching if you are thinking about selling.
More multifamily supply is coming (permits are up 7.7% year to date), so the buildings that hold occupancy through 2027 will be the ones priced and presented ahead of that competition. Resale benchmark prices also turned negative year over year in August for the first time this cycle, which matters for any valuation or refinancing conversation.
What we’d do this month
1
Price vacant suites for this market, not last spring’s
An empty month costs a full month’s rent. Taking $100 a month off a $1,200 suite costs $1,200 over a year, the same as one empty month, so an accurate price on day one usually wins.
2
Keep renewal increases modest
Renewals are still rising (1.5%) while rents on new leases are falling (−1.2%). A tenant who stays at a small increase is worth more than a bigger increase followed by a vacancy and a lower new-lease rent.
3
Offer a move-in credit before you cut the rent
A one-time credit fills the suite without lowering the rent on the lease, which is also the base for next year’s renewal. It is the first thing we reach for on a suite that is slow to lease.
4
Book turnover and winter work now
Lumber is up 6.8% on the year and construction costs keep climbing. Get quotes and book trades for late-2026 turnovers before prices and schedules tighten further.
01
What we’re seeing in our own leasing
From the 73 leases we signed in Edmonton for move-ins between May and November 2026.
1-bedroom basement suite
$1,125
Median of 18 lease rents
2-bedroom basement suite
$1,075
Median of 10 lease rents
3-bedroom main floor or townhouse
$2,108
Median of 31 lease rents
Advertised with a move-in incentive
41%
30 of 73 leases
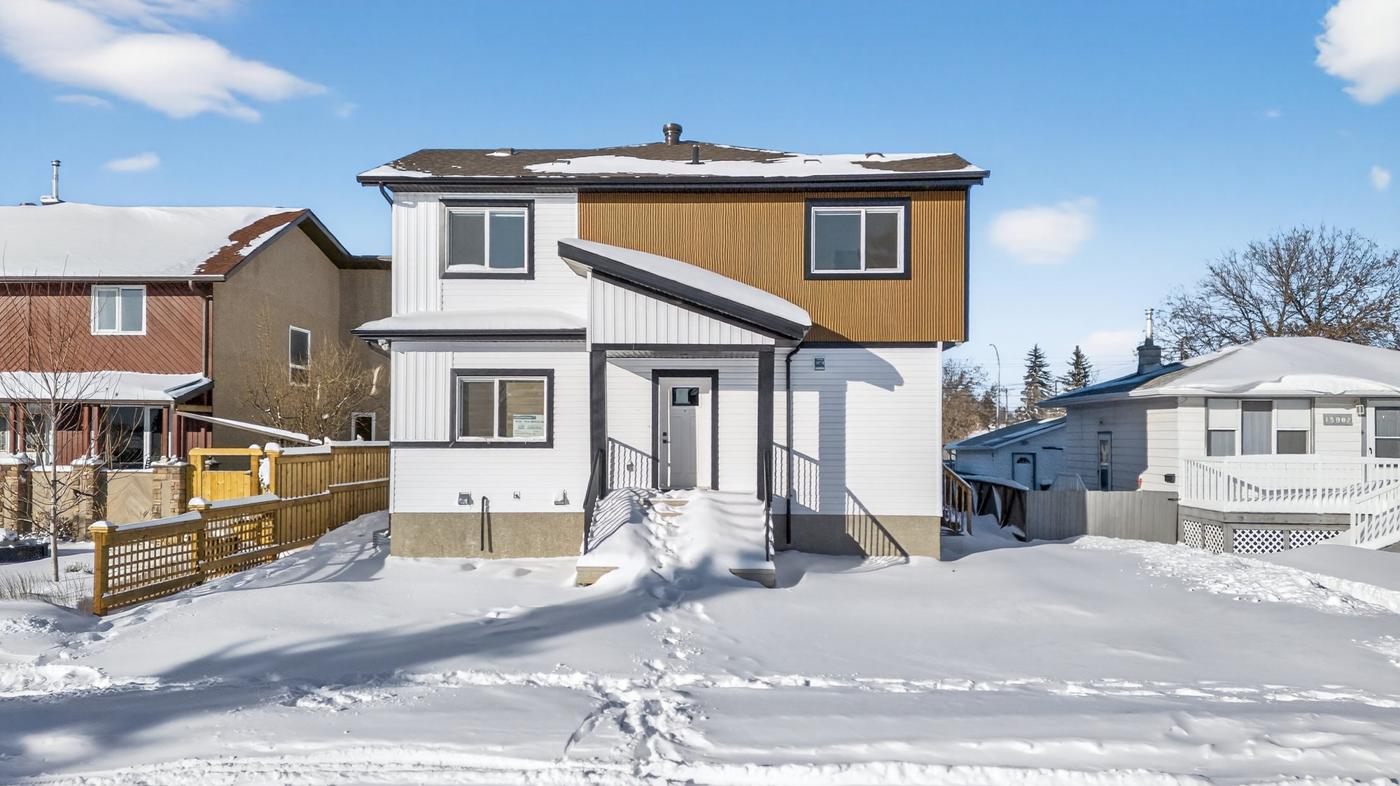
Basement suites are where renters on a budget land, and that is where incentives are doing the work. Thirteen of our 19 one-bedroom basement leases came with a move-in credit.
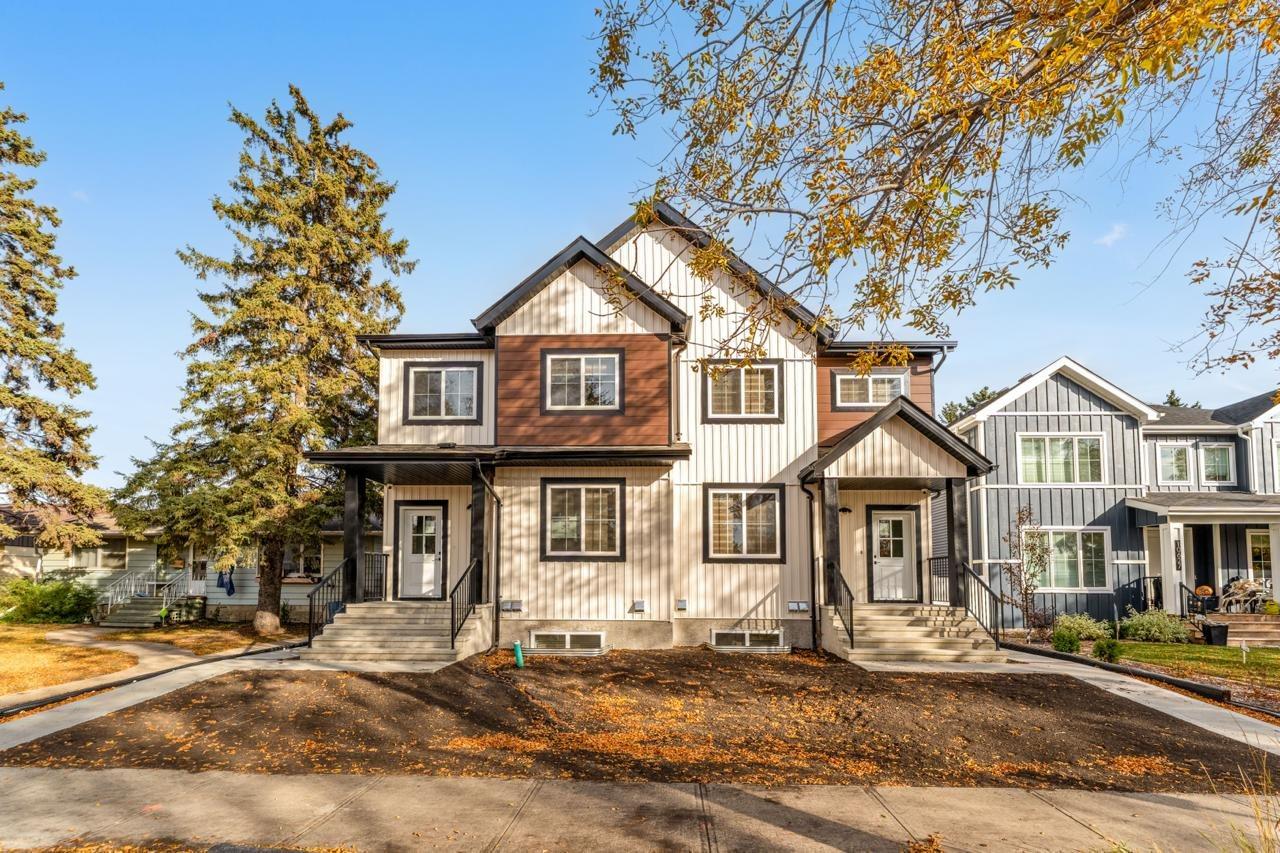
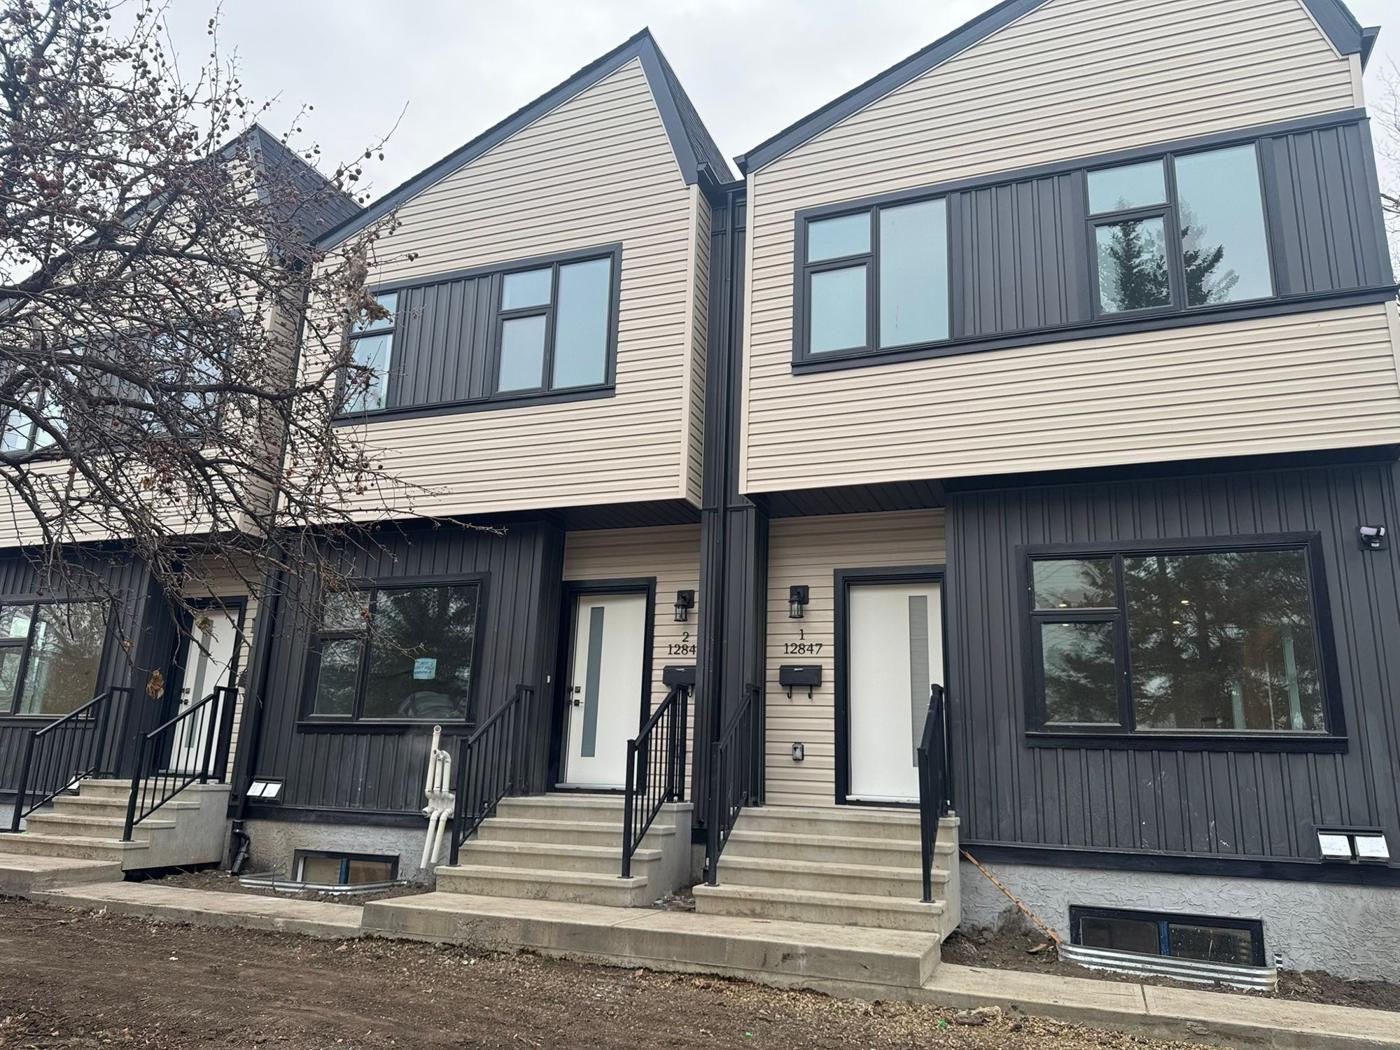
The new supply is arriving on our own streets. We are leasing 24 brand-new homes in three west Edmonton infills this fall, the kind of competition section 5 describes.
Basement suites lease well below apartment averages
Monthly rent
- Edmonton apartment average
- Basement suites we leased (median)
Show the numbers
| Edmonton apartment average | Basement suites we leased (median) | |
|---|---|---|
| 1 bedroom | $1,325 | $1,125 |
| 2 bedrooms | $1,677 | $1,075 |
Source: Stevera leases signed for May to November 2026 move-ins; apartment averages from the BILD Alberta July 2026 data package.
02
Five years of Edmonton rentals
Where today’s market sits against the last five years.
Vacancy rate
Average 2-bedroom rent
Source: CMHC Rental Market Survey, purpose-built apartments, Edmonton CMA, October of each year.
Vacancy fell from 7.3% in 2021 to 2.4% in 2023 as people moved to Alberta, and the average two-bedroom rent rose 26% between 2021 and 2025. Vacancy has risen every year since 2023.
The 5.8% reading for Q2 2026 in section 4 comes from a different survey, so it is not plotted here, but it points the same way.
03
Rates and the economy
The backdrop that sets your financing costs and tenant demand.
Bank of Canada overnight rate
2.25%
Held, 7th straight
Since the Oct 2025 cut
Edmonton inflation
4.0%
+80 bps m-o-m
Vs 1.2% a year ago
Edmonton unemployment
6.9%
−30 bps m-o-m
Labour force 955,200
Alberta net migration
5,358
−70% y-o-y
Q1 2026, mostly international
Energy prices and rising auto insurance premiums are doing most of the work on the inflation number, not shelter costs.
Migration into Alberta has cooled sharply from the surge of the past two years. That is the biggest single reason rental demand is softer this year.
Inflation is running ahead of the country
Consumer price index, July 2026, change from a year earlier
Show the numbers
| July 2026 | |
|---|---|
| Alberta | 4.2% |
| Edmonton | 4.0% |
| Canada | 3.0% |
Source: Statistics Canada, Consumer Price Index.
Since then
The Bank of Canada held again on September 2, its seventh hold in a row at 2.25%, while flagging upside risk to inflation from tariffs and energy prices. The next decision is October 28.
Alberta inflation cooled to 3.8% in August from 4.2% in July; the national rate held at 3.0%. Edmonton unemployment was unchanged at 6.9%.
04
The multifamily rental market
The numbers that matter most for day-to-day decisions on your building.
Average 1-bedroom rent
$1,325
−3.2% y-o-y
Average 2-bedroom rent
$1,677
−3.9% y-o-y
Rental vacancy
5.8%
+120 bps y-o-y
Four-year high, Q2 2026
Multifamily cap rate
5.39%
+0.7% y-o-y
Q2 2026, up on the quarter too
Renewal rent growth
1.5%
−510 bps y-o-y
Lowest since Q4 2022
New-lease rent growth
−1.2%
Q2 2026
Vs +2.2% a year ago
Vacancy is the number to watch. Expect longer time to lease and more negotiating power for tenants than at any point since early 2022.
New leases are pricing below renewals. Rents on new leases are falling (−1.2%) while renewals are still rising, slowly (1.5%). Push renewal increases too hard and a tenant who leaves gets replaced in a softer market.
Higher cap rates cut both ways. They reflect softer valuations across the market, which shows up in refinancing appraisals and in any sell-or-hold decision.
Rent growth has stalled on renewals and turned negative on new leases
Annual rent growth, second quarter
- Q2 2025
- Q2 2026
Show the numbers
| Q2 2025 | Q2 2026 | |
|---|---|---|
| Renewals (in-place) | +6.6% | +1.5% |
| New leases | +2.2% | −1.2% |
Source: BILD Alberta, July 2026 data package. Q2 2025 renewal growth is the Q2 2026 figure plus the reported 510-basis-point decline.
05
New supply and development
The competition coming online over the next 12 to 24 months.
Multifamily permits, year to date
3,476
+7.7% y-o-y
Units, through July
Single-family permits, year to date
3,676
−15.8% y-o-y
Rowhouse and apartment starts
1,496
+12% y-o-y
July
Residential permit value
$332.9M
−30.4% y-o-y
June, 7th straight annual drop
Rowhouse and apartment starts for the year are still down 14.5% despite July’s jump, so approvals are running ahead of what is actually breaking ground.
Spending on residential construction fell 34% year over year in June, the largest annual drop since Statistics Canada began the series in 2017. Builders are pulling back even as approvals rise.
Builders are shifting from houses to multifamily
Edmonton residential permits, units, January to July
- 2025
- 2026
Show the numbers
| 2025 | 2026 | |
|---|---|---|
| Multifamily | 3,227 | 3,476 |
| Single-family | 4,366 | 3,676 |
Source: BILD Alberta, July 2026 data package. 2025 figures are worked back from the reported year-over-year change and rounded.
Since then
CMHC’s August numbers show 1,796 housing starts in Edmonton, up 9% on August 2025, with Alberta up 14% while most provinces fell. For the year through August, Edmonton starts are 12,654, down 14% from 14,701, so permit growth has not yet turned into faster building.
06
The resale market
Useful for valuations, refinancing and any owner weighing a sale.
Composite benchmark price
$429,100
+0.3% y-o-y
July 2026, Greater Edmonton
Months of inventory
3.2
Up from 2.9 in June
Still a seller’s market, loosening
MLS sales
2,535
−11.4% y-o-y
July, 13th straight monthly decline
Active listings
8,142
+15% y-o-y
Most at month-end in four years
Resale supply is loosening month by month
Months of inventory, Greater Edmonton
Show the numbers
| Months of inventory | |
|---|---|
| June | 2.9 |
| July | 3.2 |
| August | 3.75 |
Source: Realtors Association of Edmonton, monthly market statistics. August is approximate.
Since then
August continued the trend: 2,143 sales (down 9.8% year over year), about 8,050 listings (up roughly 15%), and about 3.75 months of supply, the loosest of the year. The composite benchmark slipped to $426,900, down 0.6% on both the month and the year, undoing July’s brief return to annual growth.
07
Costs
What is pushing operating and capital budgets for the year ahead.
Softwood lumber prices
+6.8%
y-o-y, July
Sharpest annual jump in over a year
Residential building costs
+3.1%
y-o-y, Q2 2026
Renovation prices
+2.2%
y-o-y, Q2 2026
Growth slowing for two years
Non-residential construction costs are rising faster than residential (4.0% against 3.1%), which matters for any building with a commercial component.
Lumber is leading construction costs higher
Change from a year earlier
Show the numbers
| Latest | |
|---|---|
| Softwood lumber (July) | +6.8% |
| Non-residential building (Q2) | +4.0% |
| Residential building (Q2) | +3.1% |
| Renovation (Q2) | +2.2% |
Source: Statistics Canada, Industrial Product Price Index and Building Construction Price Index.
08
Rents in the neighbourhoods we lease
What tenants are actually paying on the leases we manage today: the monthly rent written on the signed lease, before any move-in credit. One-bedrooms are mostly basement suites; three-bedrooms are main floors and townhouses.
| Neighbourhood | 1 bedroom | 2 bedrooms | 3 bedrooms |
|---|---|---|---|
| Alberta Avenue | $1,000 | — | — |
| Britannia Youngstown | $1,000 | — | $2,199 |
| Delton | $1,150 | — | $2,100 |
| Grovenor | $1,200 | — | $2,350 |
| Lauderdale | — | $1,088 | $1,884 |
| North Glenora | — | — | $2,013 |
| Strathearn | — | — | $2,108 |
| Westwood | — | $1,075 | — |
Active and signed upcoming leases as of October 1, 2026, shown where we have at least three leases of that size. Most neighbourhoods are one building, so treat these as a guide to what newer infill rents for, not a neighbourhood average.
Want next month’s brief and Manny’s off-market picks by email? Get the Pocket List
Sources
Main data: BILD Alberta, July 2026, with August and September releases added.
- 1Stevera Property ManagementRents on the Edmonton leases we manage, including those signed for May to November 2026 move-ins.
- 2BILD AlbertaJuly 2026 data package, the main source for this issue: permits, starts, rents, vacancy, cap rates and rent growth.
- 3Statistics CanadaInflation, unemployment, migration, construction investment, lumber and building cost indexes.
- 4Bank of CanadaPolicy interest rate and decision dates.
- 5Canada Mortgage and Housing Corporation (CMHC)Rental Market Survey (Edmonton vacancy and average two-bedroom rent, 2020 to 2025) and monthly housing starts.
- 6Realtors Association of EdmontonResale sales, benchmark prices, listings and months of inventory.
- 7Rentals.ca and UrbanationAverage asking rents.
- 8YardiRental market data.
- 9Edmonton Housing Research CorporationRental market data.
- 10The Network – Real Estate IntelligenceMultifamily investment data.
Figures are the latest public releases at the time of the issue, provided for general awareness, and are not investment advice.
Brokerage: Meta West Realty Inc.